Build and manage better road networks


- Home
- HDM-4 Version 2
- HDM-4 In Use
- United Kingdom
- Using HDM-4 to investigate the marginal effects of maintenance funding with a range of budget scenarios
Using HDM-4 to investigate the marginal effects of maintenance funding with a range of budget scenarios
Authors: University of Birmingham
Executive summary reproduced with permission by the Department for Transport, UK.
ABSTRACT
The UK Department for Transport is concerned to know that long-term investments in maintenance of local roads are contributing optimally to the UK economy, and that road maintenance funds are distributed equitably and provide value for money for the taxpayer. This project set out to use the Highway Development and Management tool (HDM-4) to assess the economic benefits of a marginal change in maintenance expenditure and the implications of maintenance expenditure in terms of traffic delays. The main objective was to improve the understanding within the DfT of the costs and benefits of investing in the maintenance of local authority (LA) highway networks in England.
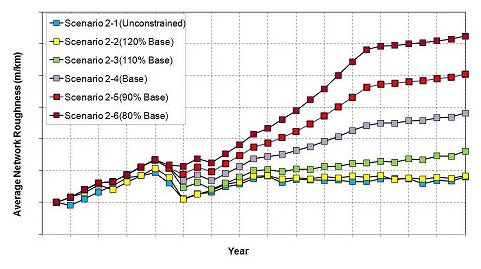
A number of funding scenarios where investigated to illustrate the effects of marginal change in expenditure and are summarised below:
- Scenario 2-1: Unconstrained budget: assumes that there are no constraints in the budget necessary for maintenance of principal road network in England.
- Scenario 2-2: Assumes a 20% increase in the base expenditure on maintenance of principal roads in England
- Scenario 2-3: Assumes a 10% increase in the base expenditure on maintenance of principal roads in England
- Scenario 2-4: Base Case: represents the current expenditure out turned by Local Authorities on principal roads, that is, an annual average capital expenditure of about £360 million.
- Scenario 2-5: assumes a 10% decrease in the base expenditure on maintenance of principal roads in England
- Scenario 2-6: assumes a 20% decrease in the base expenditure on maintenance of principal roads in England
The trend of the average network roughness for these scenarios is illusrated in the chart below.
A number of funding scenarios where investigated to illustrate the effects of different levels and durations of budget cuts. As there was a degree of uncertainty in the data giving the initial condition of the network am optimistic condition distribution, and a pessimistic consition distribution was used with the scenarios described.
Analysis Scenarios for Optimistic Condition Distribution:
-
Scenario 3-O-1: This is the Business-as-Usual scenario, it represents the current expenditure out turned by Local Authorities on principal roads, that is, an annual average capital expenditure of about £360 million.
-
Scenario 3-O-2: represents a 20% reduction in the first 3 analysis years in the Business-as-Usual capital expenditure levels, followed by the Business-as-Usual expenditure levels in the years after budget cuts are cancelled.
-
Scenario 3-O-3: represents a 20% reduction in the first 6 analysis years in the Business-as-Usual capital expenditure levels, followed by the Business-as-Usual expenditure levels in the years after budget cuts are cancelled.
-
Scenario 3-O-4: represents a 40% reduction in the first 3 analysis years in the Business-as-Usual capital expenditure levels, followed by the Business-as-Usual expenditure levels in the years after budget cuts are cancelled.
-
Scenario 3-O-5: represents a 40% reduction in the first 6 analysis years in the Business-as-Usual capital expenditure levels, followed by the Business-as-Usual expenditure levels in the years after budget cuts are cancelled.
-
Scenario 3-O-6: this scenario assumes 20% reduction in the first 3 analysis years in the Business as Usual capital expenditure levels on principal roads in England. Heavy Investments are applied after the first 3 years to return the average road network conditions in the long-term to that modelled under Scenario 3-O-1 (Business-as-Usual) Development of Socio Economic Models for Highway Maintenance: Analysis of DfT Road Network Using HDM-4 Executive Summary WSP/University of Birmingham vii
-
Scenario 3-O-7: this scenario assumes 20% reduction in the first 6 analysis years in the Business-as-Usual capital expenditure levels on principal roads in England. Heavy Investments are applied after the first 6 years to return the average road network conditions in the long-term to that modelled under Scenario 3-O-1 (Business-as-Usual)
-
Scenario 3-O-8: this scenario assumes 40% reduction in the first 3 analysis years in the Business as Usual capital expenditure levels on principal roads in England. Heavy Investments are applied after the first 3 years to return the average road network conditions in the long-term to that modelled under Scenario 3-O-1 (Business-as-Usual)
-
Scenario 3-O-9: this scenario assumes 40% reduction in the first 6 analysis years in the Business as Usual capital expenditure levels on principal roads in England. Heavy Investments are applied after the first 6 years to return the average road network conditions in the long-term to that modelled under Scenario 3-O-1 (Business-as-Usual)
Analysis Scenarios for Pessimistic Condition Distribution:
-
Scenario 3-P-1: represents the Business as Usual scenario. The current capital expenditure level on principal roads in England of £360million per year was assumed.
-
Scenario 3-P-2: represents a 20% reduction in the first 3 analysis years in the Business as Usual capital expenditure levels, followed by the Business as Usual expenditure levels in the years after budget cuts are cancelled.
-
Scenario 3-P-3: represents a 20% reduction in the first 6 analysis years in the Business as Usual capital expenditure levels, followed by the Business as Usual expenditure levels in the years after budget cuts are cancelled.
-
Scenario 3-P-4: represents a 40% reduction in the first 3 analysis years in the Business as Usual capital expenditure levels, followed by the Business as Usual expenditure levels in the years after budget cuts are cancelled.
-
Scenario 3-P-5: represents a 40% reduction in the first 3 analysis years in the Business as Usual capital expenditure levels, followed by the Business as Usual expenditure levels in the years after budget cuts are cancelled.
The final part of the project was to derive a work-zone cost matrix for the network and to illustrate these costs if included in the total maintenance expenditure for Scenario 2-1 to Scenario 2-6 described above.
The summary of results obtained for the above scenarios are described in the Executive Summary project report which can be downloaded below.
The project was a good example of how HDM-4 can be used at the strategic network level to answer the "what-if" questions regarding maintenance funding levels.
The project executive summary can be downloaded in PDF format below...
-

Technical Support
Find out about the technical support service offered by HDMGlobal to help users use HDM-4 effectively.
-
Software Updates
For existing HDM-4 users, view the latest software release and the changes made before registering to receive the updates.
-
Training & Events
Find out about HDM-4 training courses offered by HDMGlobal and their partner organisations and other related events.